Aquifer Testing Procedures in Small-Diameter, Low-Producing Wells
Small diameter wells are inexpensive to install and can be very useful for monitoring water quality and groundwater levels. However, they can also be used to characterize the hydrogeologic properties of the groundwater aquifer around the well. Constant-rate and slug tests can be used to estimate the hydraulic conductivity (k) and aquifer transmissivity (T) of the aquifer around the well.
Small-diameter wells can present issues related to aquifer testing, as there is limited equipment that can be installed in these wells. LWS has specialized equipment to adequately test small-diameter, low-production wells. The appropriate test for a particular well is dependent on the depth of the well, the diameter of the casing, as well as the sustainable yield of water from the well. For wells that can sustain a pumping rate with time, a constant-rate test can provide the data required to determine aquifer hydraulic characteristics. Pumping at too low of a rate will not provide a representative time-drawdown relationship for analysis. Conversely, pumping at too high of a rate may lead to pumping the well dry which prematurely stops the test. Therefore, flow control is essential during a constant-rate test.

Figure 1: A ball valve and flow meter used to control flow during a constant rate test.
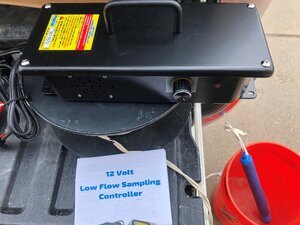
Figure 2: A Low Flow Sampling Controller used to adjust the pumping rate via a potentiometer.

Figure 3: Slug test set up. The slug has been introduced and the transducer is downhole collecting data.
There are several ways to control the discharge from a well. First, the size of pump chosen for pumping is a key factor. LWS has two different pump sizes, a single-stage and a three-stage pump. Our single-stage pump can yield up to 2.5 gallons per minute (gpm) depending on the depth of the well, whereas the three-stage pump can yield as high as 4.5 gpm, also dependent on depth. Lower flow wells may need to be controlled even further below the capacity of our pumps. In this case, either a manual flow controller, such as a valve on the outflow, can be utilized (Figure 1), or a dedicated low-flow sampling controller can be used, as shown in Figure 2. A low-flow sampling controller allows the pump to be controlled with a dial to adjust the flow rate.
There are times when even a pump with a flow controller can be too much pumping for a well to sustain. In this case, a slug test may provide the data necessary for analysis. A slug test can either use a ‘slug’ of water (Figure 3), or a displacement tool (Figure 4), that is introduced to the well to increase the water level in the well. It is important to introduce the slug of water or the water displacement tool into the well as quickly as possible. The amount of water introduced or displaced depends on the depth of the well, the diameter of the casing, and the permeability of the material in which the well is constructed. After the slug is introduced the water level decline back to a static water level is recorded by a downhole transducer and then analyzed.
Regardless of which test is appropriate for the well being analyzed, data acquisition is essential during the test. Since drawdown is a logarithmic function with time, the key to determining the aquifer hydraulic characteristics in a test is to provide a straight-line drawdown relationship with time on a semi-logarithmic plot so a steady-state condition is reached. A downhole transducer and software to monitor it in real time are vital pieces of equipment. LWS uses an In-Situ Inc. Level Troll 700 transducer (Troll) coupled with the Win-Situ 5 software and the Vu-Situ App to monitor and record the data in real-time (Figure 5). During a constant-rate test the Troll is strapped to the discharge line directly above the pump to collect data. Several static water level data points are collected initially, then the pump is turned on and the test is initiated. For a slug test, the Troll is first deployed to the bottom of the well, and recording of water levels is started before the slug is introduced so that the static water level is known. The Troll remains in the hole throughout the test until the water returns to the static level. Data can be viewed in real time to evaluate if representative test data are being collected. A plot of drawdown data is shown in Figure 6.

Figure 4: Displacement tool.

Figure 5: Field PC running Win-Situ 5 software, collecting and logging data onsite in real-time.

Figure 6: Computer screen of Win-Situ 5 software recording data in real time. The blue line on the plot shows consistent drawdown over time.
Monitoring well testing is an essential part of determining water quality, flow, and characterizing the aquifer around the well. At LWS we employ all three of these testing methods and utilize several different pump and flow control configurations to collect reliable data for analysis. This permits LWS to provide high quality results to our clients. Please feel free to contact LWS at 303-350-4090 if you have any questions about any of the tests mentioned, or if you need assistance with monitoring well installations and/or testing.
Chris Fehn, P.E., P.G., Senior Project Engineer, chris@lytlewater.com
Dan Rowe, Staff Engineer, dan@lytlewater.com